The Washington Post
washingtonpost.com
51 stories credited to The Washington Post (3 on washingtonpost.com, 48 reproduced by other sites)
Latest story Sep 22, 2026 · on ChamberLight since Sep 2026
A story can appear as several articles (copies of the same piece), so counts of stories and of articles differ.
Scores for The Washington Post
Political lean
50 stories · 95% range 44–50 · updated Sep 24, 2026
Writing quality not enough rated stories yet: 3 of 10. How it is measured
Scores last checked Sep 25, 2026.
Stories ChamberLight collected, by month
Stories credited to The Washington Post, by publication date. ChamberLight collects articles that mention the officials it tracks, so this shows its own coverage of this source, not how much the source publishes.
- Stories from The Washington Post
- Shaded: ChamberLight collected no stories, or almost none, from any outlet (a gap in its collection, not in the outlet’s publishing)
Show as a table
| Month | Stories | All outlets |
|---|---|---|
| April 2026 | 48 | 4,233 |
| May 2026 | 0 | none collected |
| June 2026 | 0 | none collected |
| July 2026 | 0 | none collected |
| August 2026 | 0 | 1 (collection gap) |
| September 2026 | 3 | 598 |
Top topics
Share of this source’s stories tagged with each topic. A story can carry several topics, so the shares do not add up to 100%.
- Ethics/Corruption34
67% of 51 stories · 57% across all outlets
- Budget/Spending18
35% of 51 stories · 31% across all outlets
- Economy15
29% of 51 stories · 24% across all outlets
- Defense/Military14
28% of 51 stories · 24% across all outlets
- Criminal Justice13
26% of 51 stories · 19% across all outlets
- Foreign Policy10
20% of 51 stories · 28% across all outlets
- Voting Rights10
20% of 51 stories · 18% across all outlets
- Healthcare9
18% of 51 stories · 7% across all outlets
The thin mark on each bar is the topic’s share across all outlets.
Who they cover
Party of the officials these stories are mainly about, across all 44 officials named. A story counts once for each official it is mainly about, so the split is over 105 story–official pairs, from 51 stories.
- Republican69% · 72 pairs
- Democrat26% · 27 pairs
- Party not recorded4% · 4 pairs
- Independent2% · 2 pairs
Most covered
Stories mainly about each official, and their share of the source’s 51 stories.
- 1Donald TrumpR19 stories · 37%
- 2Eric SwalwellD8 stories · 16%
- 3Tony GonzalesR8 stories · 16%
- 4Markwayne MullinR7 stories · 14%
- 5Cory MillsR4 stories · 8%
- 6Robert F. Kennedy Jr.R4 stories · 8%
- 7J. VanceR3 stories · 6%
- 8Marco RubioR3 stories · 6%
- 9Michael LawlerR3 stories · 6%
- 10Mike JohnsonR3 stories · 6%
+ 34 other officials (43 story–official pairs)
Article tone
ChamberLight’s article analysis assigns each story a tone toward the official it covers. It describes the coverage of that official, not The Washington Post’s stance, and reader votes do not change it. 51 stories.
- Good Look
- 6 (12%)
- Mixed
- 32 (63%)
- Informational
- 1 (2%)
- Bad Look
- 12 (24%)
Related sources
Lean 95% range 45–48 · updated Sep 25, 2026
Similar lean · 2 shared topics
Lean 95% range 45–48 · updated Sep 25, 2026
Similar lean · 3 shared topics
Lean 95% range 46–50 · updated Sep 24, 2026
Similar lean · 2 shared topics
Lean 95% range 46–50 · updated Sep 24, 2026
Similar lean · 3 shared topics
Lean 95% range 46–51 · updated Sep 25, 2026
Similar lean · 1 shared topic
Lean 95% range 46–50 · updated Sep 25, 2026
Similar lean · 2 shared topics
Challenges to these scores
No one has challenged a score on this page yet. Anyone can; editors publish every outcome here.
Articles served from washingtonpost.com
5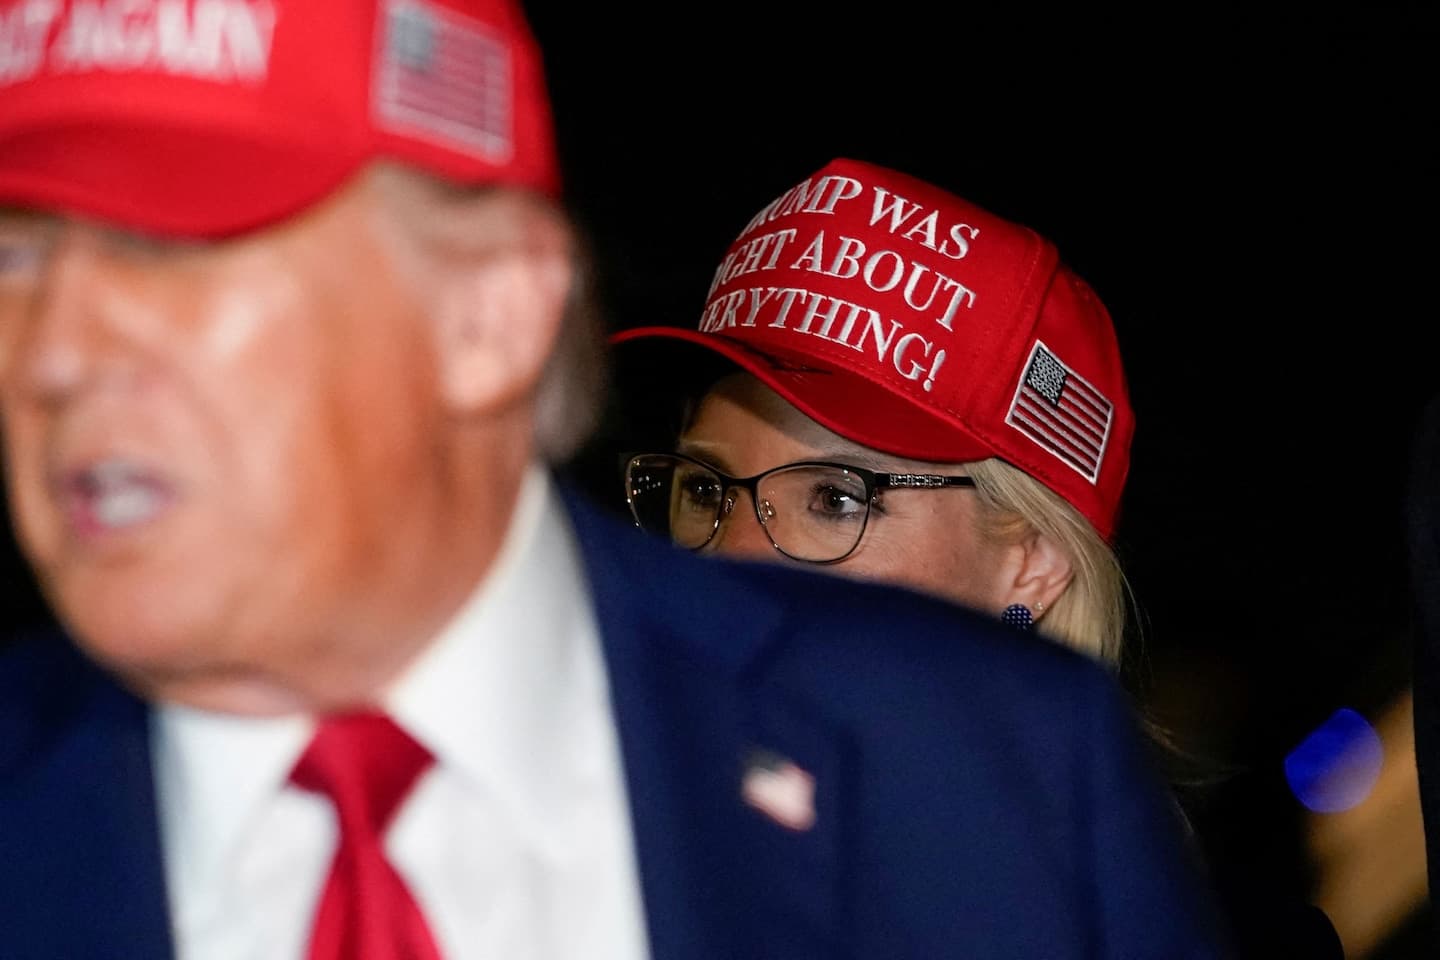
Republican candidates are breaking with Trump on Iran as midterms loom
Republicans in key battleground states are urging a speedy end to the war as new polling suggests only 1 in 4 Americans support it. Republican candidates in key battleground states are starting to break with President Donald Trump on Iran as polls show the conflict -- and its domestic ramifications
Republican candidates are breaking with Trump on Iran as midterms loom
Republicans in key battleground states are urging a speedy end to the war as new polling suggests only 1 in 4 Americans support it. Republican candidates in key battleground states are starting to break with President Donald Trump on Iran as polls show the conflict -- and its domestic ramifications

Congressional leaders warn White House against adding controls over NIH grants
Leaders of the House and Senate appropriations committees on Monday warned the White House not to impose new controls on how the National Institutes of Health awards billions of dollars in research grants. Sens. Susan Collins (R-Maine) and Patty Murray (D-Washington), the Senate panel's chair and v
Congressional leaders warn White House against adding controls over NIH grants
Leaders of the House and Senate appropriations committees on Monday warned the White House not to impose new controls on how the National Institutes of Health awards billions of dollars in research grants. Sens. Susan Collins (R-Maine) and Patty Murray (D-Washington), the Senate panel's chair and v
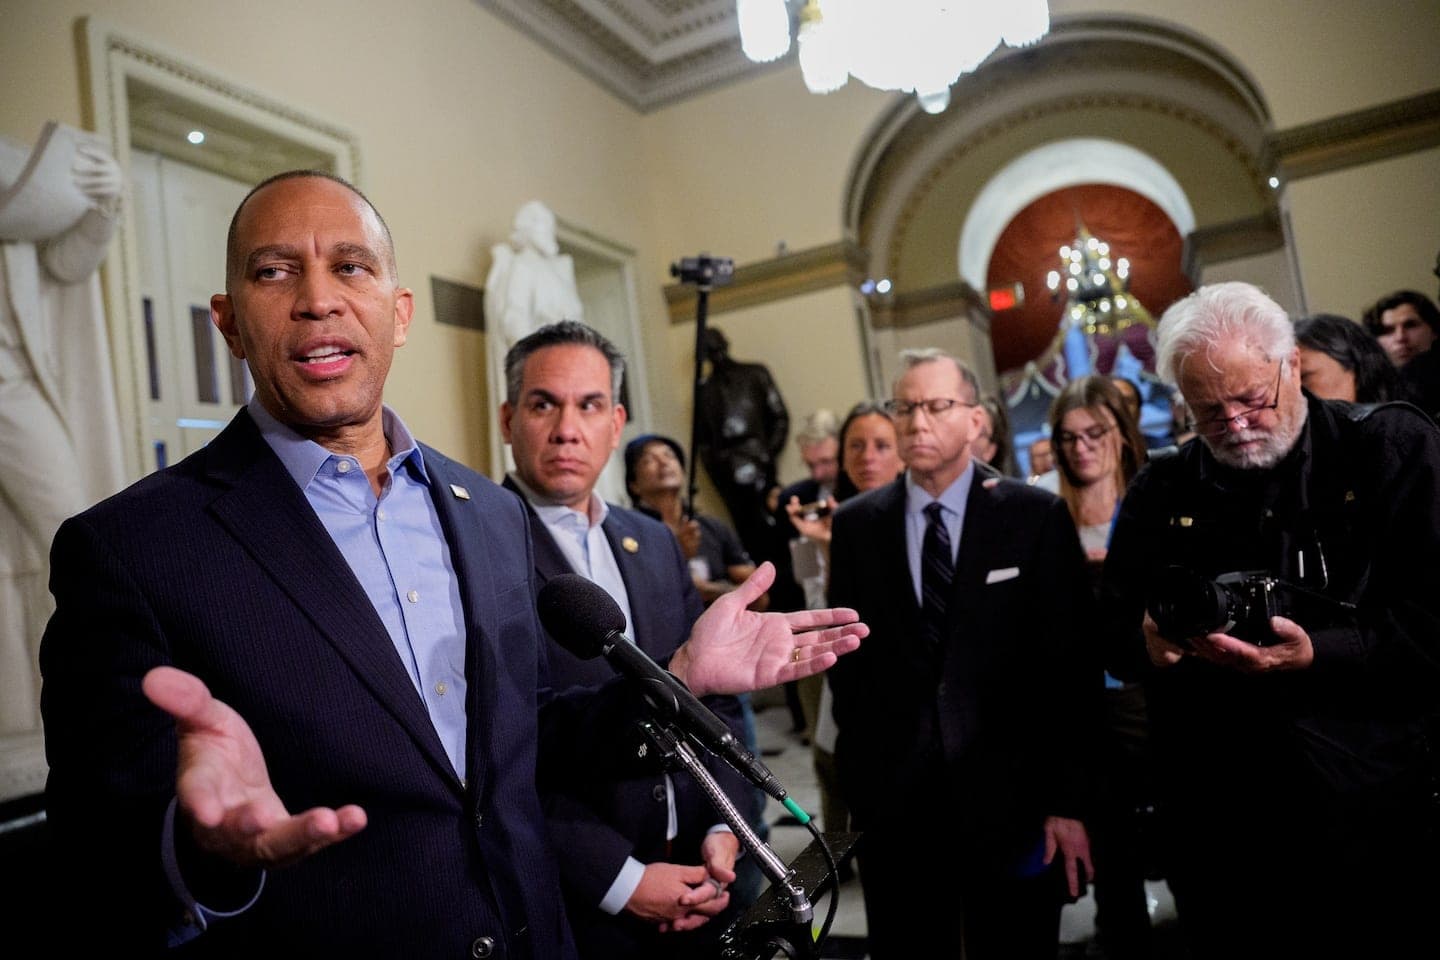
Democrats seize on House GOP's decision to leave town early
Democrats were ready to pounce when Speaker Mike Johnson (R-Louisiana) sent the House home a day earlier than planned this week after already having canceled the final two weeks of votes scheduled ahead of the November midterms. "What are Republicans doing?" asked Minority Leader Hakeem Jeffries at